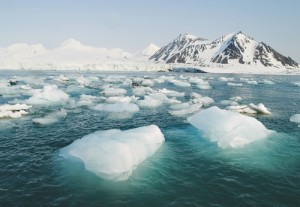
The decline of Arctic sea ice is often pointed to as one of the most visible indicators of a warming world but earlier this week the Mail on Sunday published an article claiming the ice is in recovery. This was followed by similar stories in The Express and The Telegraph.
However, yesterday there were stories on BBC online and CBS News, among others, saying satellite evidence confirms the on-going story of long-term decline. So what’s really going on?
Year to year variability
Arctic summer sea ice extent has a lot of year-to-year variability because it can be heavily influenced by weather patterns:
Temperatures naturally vary from one year to the next;
the amount of cloud can affect the amount of surface melting;
summer storms can also break up ice, which can accelerate the melting process;
settled conditions can be more conducive to ice forming;
winds may act to spread out the ice or push it together.
Due to this high degree of variability, it’s important to look past short-term fluctuations in sea ice extent and look at the longer records.
Also sea ice extent is only one part of the story; it’s the volume of sea ice that we should also be considering that depends on ice thickness as well as extent.
The longer-term view
Satellites provide the most comprehensive measurements of sea ice extent, and have provided data since 1979. They show a long-term trend of decline in sea ice extent, at an annual rate of more than 4% per decade.
The seasonal minimum (September) ice extent has declined at the faster rate of 11% per decade, and this rate of decline has accelerated in the past 15 years.
More importantly the volume of sea ice has declined substantially since 1979, as the ice has thinned. This has made the ice much more vulnerable to stormy weather, as was the case in 2012.
How does this fit the news stories?
The Mail on Sunday article points to a big recovery in Arctic sea ice compared to last year, but this needs to be viewed in context.
Last year’s minimum sea ice extent was 3.41 million square kilometres according to the US National Snow and Ice Data Center (NSIDC), 0.76 million square kilometres lower than the previous record set in 2007.
Extent has not yet reached its minimum for 2013, so it’s too early to make any definitive judgements. However, using NSIDC data to August this year we know that while the ice cover was greater than at the same time last year, it was still ranked as the sixth lowest August extent in the 34-year record.
Ann Keen, Sea Ice Scientist at the Met Office, said: “In 2012 we saw a record low which was likely to have been influenced by a storm which swept through the region in summer, but this year’s weather conditions appear to have been less conducive to ice loss.
“We know sea ice extent is going to vary from year to year due to weather conditions and that’s not at all inconsistent with the overall decline in extent. You wouldn’t expect to see records broken year after year, so this ‘recovery’ is not unexpected.
“In fact, model simulations of sea ice suggest that a as the ice gets thinner you actually get more year to year variability in extent because larger areas of the ice are more vulnerable to melting away completely over the summer.”
The stories published yesterday use new data from a satellite named CryoSat which looks at sea ice volume, which gives a better view of the relative ‘health’ of the sea ice.
Data from this satellite shows that the ice continues to thin and the volume of sea ice continues to shrink.
So all the evidence suggests the long-term decline of Arctic sea ice continues.
© Met Office


